High Performance Python
High Performance Python: Book Notes#
1. Performant Python#
Programming computers can be thought of as moving bits of data and transforming them in special ways to achieve a particular result.
There is what real hardware does - the efficient way and what python does.
The fundamental computer system#
- Computing units: CPU - operations that can be done a second
- Memory units: memory - how much data it can hold, how fast are reads and writes
- Connections between: communication layers - buses
CPU#
Ability to transform bits into other bits
- Number of operations in a cycle - IPC (Instructions per cycle)
- Number of cycles in a second - clock speed
Amdahl’s law is this: if a program designed to run on multiple cores has some subroutines that must run on one core, this will be the limitation for the maximum speedup that can be achieved by allocating more cores.
A major hurdle with utilizing multiple cores in Python is Python’s use of a global interpreter lock (GIL). The GIL makes sure that a Python process can run only one instruction at a time, regardless of the number of cores it is currently using.
Memory#
Used to store bits.
Read and write speeds impacted by:
- How it is read: sequential read vs random - sequential reads are fast
- Latency: the time it takes to read
- L1/L2 cache - extremely fast, small amount of data - all data in cpu goes here
- RAM - stores application code fast (64 GB range)
- SSD - Solid state drive - faster read/write speeds than HD
- Spinning disk HD - slow (large volume)
Speed increases - size decreases.
Communication Layers#
- Fronside bus connects RAM and L1/L2 Cache
- External buses connect devices to CPU and memory
Drawback of GPUs is they are usually on a PCI bus which is slowed than a frontside bus
Network can also be seen as a bus.
Most important part of communication is speed of the communication
Idealised Computing#
Avoid moving data around as much as possible
Python’s Virtual Machine#
The Python interpreter (virtual machine) does a lot of work to try to abstract away the underlying computing elements that are being used. No thought is needed as to the amount of memory to reserve for an array - or the sequence it is sent to cpu.
What is hurting perofrmance:
- Pythons objects not layed out in the optimal way in memory due to garbage collection
- it is interpreted with dynamic types - algorithmic optimisations cannot happen before hand at compile time.
- The Global Interpreter Lock (GIL) - only a single core can be used at a time
2. Profiling to find Bottlenecks#
Profiling lets us find the biggest gains from the least amount of work.
You could, of course, skip profiling and fix what you believe might be the problem—but be wary, as you’ll often end up “fixing” the wrong thing.
Verify, don’t trust.
Extract a test case and isolate the piece of the system under test.
Used tools:
%timeittime.time()- a timing decorator
Always profile - get evidence.
timeittemporarily turns off the garbage collector
Simple Approaches to Timing#
Print statements:
$ python3.7 julia1.py
Length of x: 1000
Total elements: 1000000
calculate_z_serial_purepython took 7.012973070144653 seconds
300.0
At the core of the timing:
import time
start_time = time.time()
output = calculate_z_serial_purepython(max_iterations, zs, cs)
end_time = time.time()
print(
    f"{calculate_z_serial_purepython.__name__} took {end_time-start_time:.5f} seconds"
)
Using TImeit#
With python module:
$ python -m timeit -n 2 -r 1 -v -s "import julia1_nopil; julia1_nopil.calc_pure_python(desired_width=1000, max_iterations=300)"
Length of x: 1000
Total elements: 1000000
calculate_z_serial_purepython took 6.698742866516113 seconds
raw times: 2.96 usec

2 loops, best of 1: 1.48 usec per loop
Not giving the expected results of 6.69s per loop
Or with ipython:
ipython
%timeit julia1.calc_pure_python(desired_width=1000, max_iterations=300)
By default, if we run
timeiton this function without specifying-nand-r, it runs 10 loops with 5 repetitions
Using Unix time#
$ /usr/bin/time -p python julia1_nopil.py
Length of x: 1000
Total elements: 1000000
calculate_z_serial_purepython took 6.756645202636719 seconds
real         7.40
user         7.22
sys          0.09
real- wall clock or elapsed timeuser- amount of time cpu spent on task outside kernel functionssys- time spent in kernel level functions
To get an idea of the time spent in I/O (waiting for I/O) - subtract the real time from the user and sys cpu time.
io_wait = real - (user + sys)
io_wait = 7.4 - (7.22 + 0.09) = 7.4 - 7.31 = 0.09
Could also indicate the system running other tasks
There is a --verbose flag on some time implementations
Using cProfile#
A good practice when profiling is to generate a hypothesis about the speed of parts of your code before you profile it.
python -m cProfile -s cumulative julia1_nopil.py
Results:
Length of x: 1000
Total elements: 1000000
calculate_z_serial_purepython took 10.79547381401062 seconds
        36221995 function calls in 11.581 seconds

Ordered by: cumulative time

ncalls  tottime  percall  cumtime  percall filename:lineno(function)
        1    0.000    0.000   11.581   11.581 {built-in method builtins.exec}
        1    0.030    0.030   11.581   11.581 julia1_nopil.py:1(<module>)
        1    0.619    0.619   11.551   11.551 julia1_nopil.py:23(calc_pure_python)
        1    8.396    8.396   10.795   10.795 julia1_nopil.py:9(calculate_z_serial_purepython)
34219980    2.400    0.000    2.400    0.000 {built-in method builtins.abs}
2002000    0.130    0.000    0.130    0.000 {method 'append' of 'list' objects}
        1    0.006    0.006    0.006    0.006 {built-in method builtins.sum}
        3    0.000    0.000    0.000    0.000 {built-in method builtins.print}
        4    0.000    0.000    0.000    0.000 {built-in method builtins.len}
        2    0.000    0.000    0.000    0.000 {built-in method time.time}
        1    0.000    0.000    0.000    0.000 {method 'disable' of '_lsprof.Profiler' objects}
Results interpreted:
- 36221995 function calls in 11.581 seconds (can see increase in time from adding profiling - adds 5 seconds)
julia1_nopil.py:1is executed once and takes a total of11.581seconds- The call to
calculate_z_serial_purepythonconsumes8.396seconds 34219980calls toabstake2.4secondslsprof- is the original name of the tool that becamecProfile
Figuring out what is happening on a line-by-line basis is very hard with cProfile, as we get profile information only for the function calls themselves, not for each line within the functions.
Visualizing cProfile Output with SnakeViz#
Snakeviz is a visualiser for cProfile. Use it to get a high level view.
pip install snakeviz
Generate an output file:
python -m cProfile -o nopil_stats julia1_nopil.py
The
sortcan be set within snakeviz
View stats:
snakeviz nopil_stats
The output:
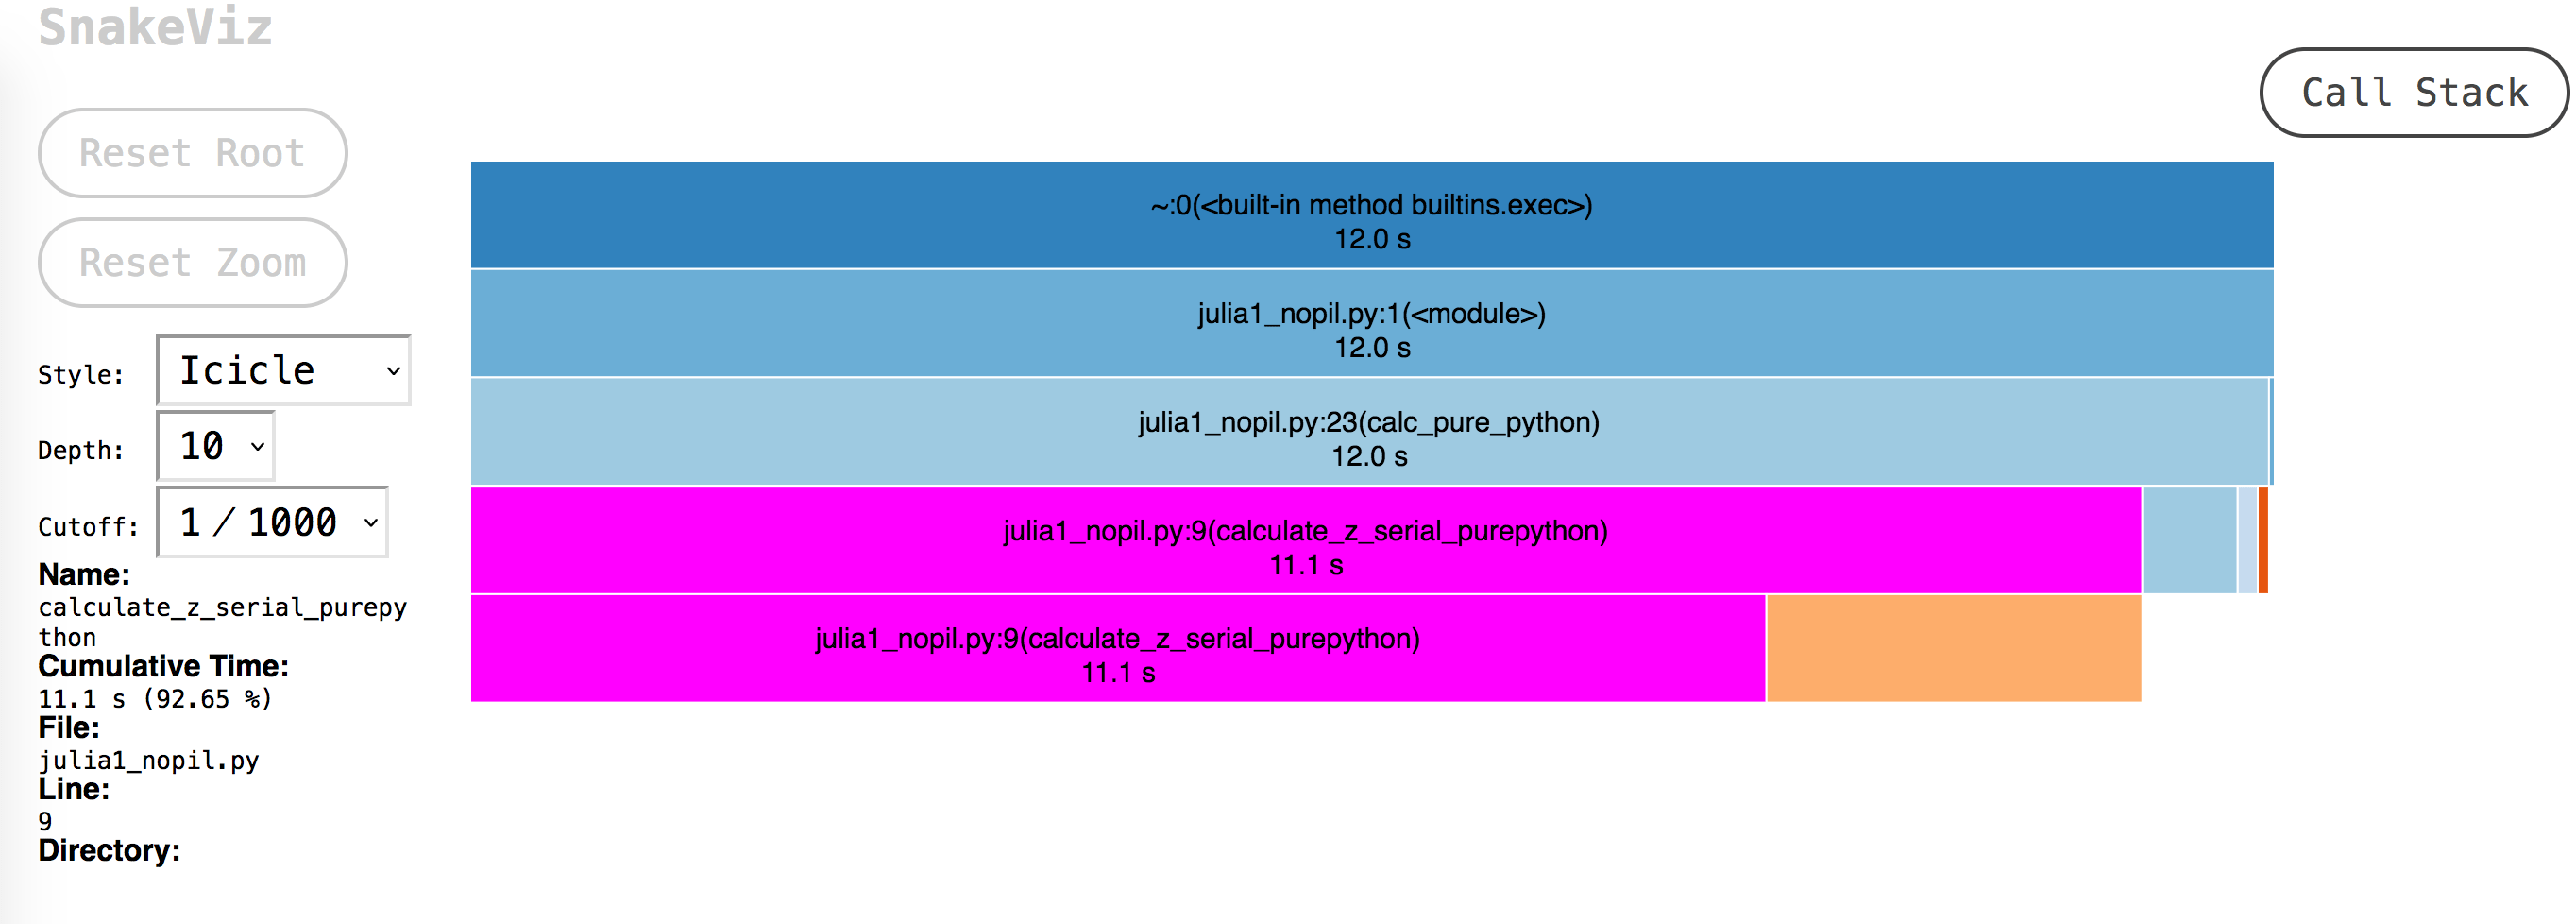
From the screenshot - one can see most of the time is spent in calculate_z_serial_purepython
Lineprofiler#
There is a quickstart on the github readme
pip install line_profiler[ipython]
Easiest way to get started is using the kernprof cli tool:
kernprof -l script_to_profile.py
One caveat is that the lines one wants to profile should be decorated with
@profile
The result file will be of the form:
script_to_profile.py.lprof
One can view it with:
python -m line_profiler script_to_profile.py.lprof
Example output (note the line by line data):
$ python -m line_profiler julia1_nopil.py.lprof
Timer unit: 1e-06 s

Total time: 37.7054 s
File: julia1_nopil.py
Function: calculate_z_serial_purepython at line 9

Line #      Hits         Time  Per Hit   % Time  Line Contents
==============================================================
    9                                           @profile
    10                                           def calculate_z_serial_purepython(maxiter, zs, cs):
    11                                               """Calculate output list using Julia update rule"""
    12         1       4748.0   4748.0      0.0      output = [0] * len(zs)
    13   1000000     354483.0      0.4      0.9      for i in range(len(zs)):
    14   1000000     272454.0      0.3      0.7          n = 0
    15   1000000     321252.0      0.3      0.9          z = zs[i]
    16   1000000     289563.0      0.3      0.8          c = cs[i]
    17  33219980   15822738.0      0.5     42.0          while abs(z) < 2 and n < maxiter:
    18  33219980   11018905.0      0.3     29.2              z = z * z + c
    19  33219980    9304361.0      0.3     24.7              n += 1
    20   1000000     316912.0      0.3      0.8          output[i] = n
    21         1          0.0      0.0      0.0      return output
MemoryProfiler#
It depends on psutil
No longer actively maintained
pip install memory_profiler
Run without profile statements and plot:
mprof run --python python julia1_nopil.py
or plot with:
mprof run julia1_memoryprofiler.py
2. Lists and Tuples#
Ordering is important. If the order is known (the position of items is known) they can be retrieved in O(1).
- Lists - dynamic - can be modified and resized
- Tuples - static - fixed and immutable
System memory can be seen as numbered buckets - each holding a number. Python stores data by reference - the number it stores points to the data we care about. These buckets can store any type of data.
When array is created - a request is made to the kernel for N consecutive blocks.
In python, lists also store how large they are. The zeroth item is the length.
By keeping the list in consecutive addresses - if one needed element 5. You would just get the data from the address at address zero + 5.
It is O(n) regardless of the size of the list.
Proof:
import timeit

if __name__ == "__main__":

    result_10 = timeit.timeit(
        "list_10[5]", setup="list_10 = list(range(10))", number=10_000_000
    )
    print(f"{result_10:.10f} s")

    result_10_000_000 = timeit.timeit(
        "list_10_000_000[100_000]",
        setup="list_10_000_000 = list(range(10_000_000))",
        number=10_000_000,
    )
    print(f"{result_10_000_000:.10f} s")
Should return results that are equal:
$ python timeit_lists.py
0.2828672480 s
0.2874119540 s
What if the elements are not ordered?
A search operation needs to be performed. The basic approach is a linear search. Where we iterate over every item and check for equality.
def linear_search(needle, array):
    for i, item in enumerate(array):
        if item == needle:
            return i
    return -1
The worst case is O(n)
This is the exact algorithm that list.index() uses.
If the list is sorted - special algorithms can bring down search time to O(log n)
Tim sort can sort through a list in O(n) in the best case (and in O(n log n) in the worst case)
timsort hybridises insertion and merge sort
Once sorted a list can be searched in O(log n) at the average case. Halving the list each time.
Tuples are cached by the Python runtime, which means that we don’t need to talk to the kernel to reserve memory every time we want to use one.
generic code will be much slower than code specifically designed to solve a particular problem
Python overallocates (assigned more memory than is strictly necessary) when an append is received on a list. It does not overallocate on list creation.
memitis installed viamemory_profiler
List allocation equation:
M = (N >> 3) + (3 if N < 9 else 6)
Known as bitwise operations Shift n 3 bits right. Add 3 if N < 9 else add 6.
eg. (100 >> 3) + (3 if 100 < 9 else 6) = 18
So 118 will be allocated for a list with 100 elements when append is called on it.
Even for 100,000 elements, we use 2.7× the memory by building the list with appends versus a list comprehension:
from memory_profiler import profile

@profile
def run_append():
    my_list = [];
    for i in range(100_000):
            my_list.append(i*i)

@profile
def run_lc():
    result = [i*i for i in range(100_000)]

if __name__ == "__main__":
    run_lc()

    run_append()
Results:
Line #    Mem usage    Increment  Occurrences   Line Contents
=============================================================
    9     15.0 MiB     15.0 MiB           1   @profile
    10                                         def run_lc():
    11     18.5 MiB  -1121.4 MiB      100003       result = [i*i for i in range(100_000)]


Filename: /Users/stephen/projects/playground/python-performance/3/memit_list_append.py

Line #    Mem usage    Increment  Occurrences   Line Contents
=============================================================
    3     16.4 MiB     16.4 MiB           1   @profile
    4                                         def run_append():
    5     16.4 MiB      0.0 MiB           1       my_list = [];
    6     18.6 MiB  -1123.3 MiB      100001       for i in range(100_000):
    7     18.6 MiB  -1121.0 MiB      100000               my_list.append(i*i)
appending used more memory (9.3% more)
Timing:
import timeit

if __name__ == "__main__":

    result_lc = timeit.timeit("[i*i for i in range(100_000)]", number=100)
    print(f"{result_lc:.10f} s")

    result_append = timeit.timeit(
        """
my_list = []
for i in range(100_000):
    my_list.append(i*i)
""",
        number=100,
    )
    print(f"{result_append:.10f} s")
Results:
0.8004545310 s
1.1344103980 s
It is a bit slower as there are more statements to run and the cost of reallocating memory
Due to resource caching. Tuples allocate faster.
In [1]: %timeit l = [0, 1, 2, 3, 4, 5, 6, 7, 8, 9]
61.9 ns ± 2.73 ns per loop (mean ± std. dev. of 7 runs, 10,000,000 loops each)

In [2]: %timeit t = (0, 1, 2, 3, 4, 5, 6, 7, 8, 9)
12.2 ns ± 0.484 ns per loop (mean ± std. dev. of 7 runs, 100,000,000 loops each)
Lists and tuples are low overhead when there is intrinsic ordering
Dictionaries and Sets#
Sets and dictionaries are good for data that has no intrinsic order, but has a unique object to reference it. The reference object is the key and the value is the data. Sets are a collection of keys.
Lists and tuples give at best O(logn) lookup times. Dicitonaries and sets give O(1) lookup time.
Dictionaries and sets also have O(1) insert time.
The underlying data structure is an open address hash table.
Sets are unique. There are never duplicates. Properties of good keys.